November 7, 2025
How to Troubleshoot Kubernetes: Identify and Fix Issues Like a Pro

By Shyam Kapdi
Improwised Technologies Pvt. Ltd.
How to Troubleshoot Kubernetes: Identify and Fix Issues Like a Pro
Kubernetes clusters power production workloads across industries, but diagnosing failures within such a distributed system requires more than running a few commands. Troubleshooting Kubernetes effectively is about understanding system behavior, interpreting signals, and applying structured reasoning rather than trial-and-error fixes.
Effective troubleshooting isn’t just about knowing a few kubectl commands; it’s about adopting a systematic diagnostic mindset and understanding the cascading impact of seemingly small configuration errors.
An issue with a single YAML file or an overzealous resource limit in a Kubernetes environment can halt an entire application deployment. This guide elevates debugging from reactive fire-fighting to proactive, expert systems analysis.
Understanding Kubernetes Troubleshooting Basics
Kubernetes troubleshooting is an exercise in checking dependencies and state transitions. The most crucial concept to master is that of the Kubernetes Control Loop.
- kubectl reveals object states in real time - especially when combined with flags like
--watch or -o wide. - Events and logs expose transitional issues. Use
kubectl describe pod <pod-name>to reveal the sequence of failures rather than just the current status. - Observability stacks such as Prometheus, Grafana, or OpenTelemetry provide long-term behavioral patterns that surface subtle degradation before full failure.
Defining the problem’s scope - node-level, namespace, or system-level - is key. Start narrow, validate hypotheses, and expand only when needed. This minimizes noise and helps pinpoint the root cause faster.
Common Kubernetes Issues and Their Solutions
1. Pod CrashLoopBackOff
Most CrashLoopBackOff issues trace back to application misconfigurations, failed environment variables, or startup dependency failures.
Step-by-Step Fix:
- Run
kubectl describe pod <pod>- note the last state and termination reason. - Inspect logs:
kubectl logs <pod> --previous. - Check readiness/liveness probe definitions - are they too strict?
- Validate environment variables and ConfigMaps.
- Use ephemeral containers for live debugging (
kubectl debug it <pod>).
2. Pods Stuck in Pending
Pending pods usually indicate scheduling constraints or insufficient cluster resources.
- Inspect
kubectl describe podfor “FailedScheduling” events. - Check node taints and tolerations, affinity/anti-affinity rules, and resource requests exceeding node capacity.
- With autoscaling clusters, verify the Cluster Autoscaler logs to confirm new nodes are being provisioned.
3. ErrImagePull / ImagePullBackOff
These are authentication or image path issues, but the nuance lies in registry access.
- Run
kubectl describe podto read pull errors; often, they reveal incorrect image tags or missing credentials. - Ensure imagePullSecrets match the namespace scope and registry credentials.
- Avoid using the
latesttag; fixed image versions bolster reproducibility and reduce hidden drift.
4. PodInitializing and Probe Conflicts
Startup probe delays are often misunderstood.
- When initialization scripts or sidecars take longer than expected, configure
startupProbeinstead of relying solely onreadinessProbe. - Sequence your init containers and validate volume dependencies before the app starts.
5. Node NotReady or Resource Pressure
Nodes entering NotReady often experience runtime or kernel-level errors.
- Check
kubectl describe nodefor disk pressure, memory issues, or network timeouts. - Review kubelet logs via
journalctl -u kubelet. - Node resource exhaustion can occasionally be solved by tuning eviction thresholds rather than increasing node counts.
Troubleshooting Kubernetes Networking and Services
Network-related problems in Kubernetes often involve service selector mismatches or missing endpoints, causing traffic to fail to route. Regularly verify that service selectors match pod labels accurately.
DNS resolution failures in CoreDNS can cripple service discovery - inspect CoreDNS pods and logs for anomalies.
Network policies can inadvertently block essential traffic; thorough review and testing of ingress and egress rules help isolate these problems.
- Selector mismatch: If a Service’s selector doesn’t match Pod labels, the Endpoints list will be empty. Run
kubectl get endpoints <service>to confirm. - DNS failures: Inspect
kubectl logs -n kube-system -l k8s-app=kube-dnsfor CoreDNS crashes. Often, it’s a wrong upstream resolver or high latency within the cluster VPC. - Network policies: Tight egress rules can silently block inter-namespace calls. Temporarily disable policies and use
curlorncfor in-cluster testing.
Storage and Persistent Volume Claim (PVC) Troubleshooting
Persistent storage issues are among the trickiest, requiring awareness of both Kubernetes abstraction and external provider behavior. A PVC marked Pending usually indicates a mismatch between the requested StorageClass and available PVs. Use kubectl describe pvc <name> and then kubectl get pv to confirm compatibility. Experts also check access modes (ReadWriteOnce vs. ReadWriteMany) to ensure multi-pod sharing doesn’t violate provider rules.
How to Diagnose and Fix PVC Binding Failures
- StorageClass Match: Does the PVC request a
storageClassName?Does a PV exist (or can be dynamically provisioned) with the same name? A blankstorageClassNameon the PVC requires a PV with a blankstorageClassNameor a cluster-default StorageClass. - Access Mode Match: If the PVC requests
ReadWriteOnce, does the available PV offer at leastReadWriteOnce?A PV offeringReadOnlyManywill not bind to a PVC requestingReadWriteOnce. This is a strict match. - Capacity Match: Is the available PV capacity equal to or greater than the PVC request?
- Events Review: Always run
kubectl describe pvc <pvc-name>. The Events section will contain the explicit reason from the Volume Controller, which often includes the phrase “waiting for first consumer to create volume” (if applicable) or “no persistent volumes available for this claim.”
Troubleshooting Volume Mounting (FailedAttachVolume, FailedMount)
When the PVC is Bound but the Pod fails to start, the Kubelet is failing to execute the mount. This usually points to a node-level issue or a bug in the specific CSI driver. The unique step here is to check the Kubelet logs on the specific node where the Pod is attempting to mount, as the error is often localized there, not in the Kubernetes API.
Using Kubernetes Events and Logs for Deep Troubleshooting
Events in Kubernetes provide time-stamped insight into cluster and pod activities. Frequent examination via kubectl get events or filtered with selectors helps correlate symptoms with causes.
Container logs are indispensable for application-level debugging, while audit logs support security and configuration troubleshooting. Interpreting common event messages (e.g., FailedScheduling, BackOff) sharpens problem resolution skills dramatically.
- Use
kubectl get events --sort-by=.metadata.creationTimestampduring any incident. - Prioritize
Warningevents; cross-match timestamps with affected pods. - For deeper insight, include audit logs to trace API operations that triggered chain reactions (for example, a ConfigMap update restarting Deployments)
Also Read: Fargate vs. Kubernetes: An In-Depth Comparison for Container Orchestration.
Health Checks and Probes: Liveness, Readiness, Startup
Correct configuration of health probes is critical for pod stability. Misconfigured probes can cause pods to restart unnecessarily or delay readiness, impacting availability. Consider probe failure thresholds, timeout periods, and startup delays carefully to align with application behavior. Monitoring probe status with kubectl describe pod helps diagnose issues early in deployment cycles.
- Keep initial delay values (initialDelaySeconds, timeoutSeconds) realistic; many crashes stem from impatient readiness settings.
- Test probes manually using
curl localhost:<port>healthbefore applying them. - Use startup probes for slow-boot apps like Java or ML-based workloads.
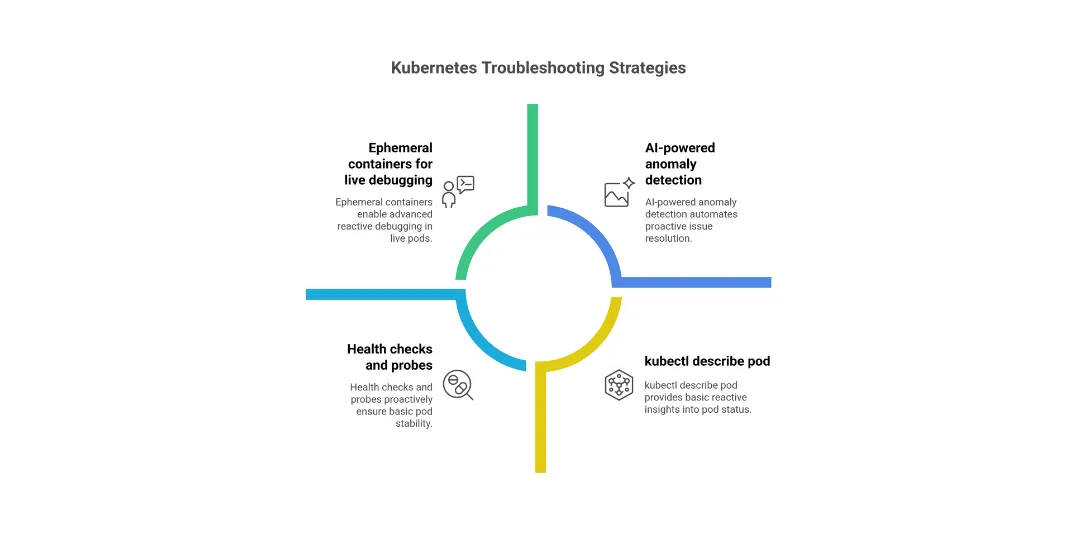
Advanced Troubleshooting Techniques
Ephemeral containers enable live debugging within running pods without disruption - a powerful approach for advanced users.
Node-level profiling and log analysis provide deeper insights into hardware or OS-level constraints.
Leveraging third-party observability tools featuring comprehensive dashboards aids in correlating complex metrics and logs.
Cutting-edge AI-powered troubleshooting automates anomaly detection and suggests resolutions, improving operational efficiency.
Key methods:
- Use ephemeral containers with
kubectl debugto attach temporary shells to live Pods without redeploying. - For Node-level profiling, use
crictlandsystemd-analyzeto capture runtime bottlenecks. - Adopt observability stacks like Grafana Tempo for distributed tracing to correlate inter-service latency.
- Evaluate AI-powered tools (e.g., Komodor, Dynatrace, or BotKube) that correlate symptoms across layers and trigger automated diagnostics.
Best Practices and Common Pitfalls
Avoid using the latest tag for container images to prevent unpredictable updates. Define affinity and anti-affinity rules explicitly to control pod placement efficiently. Set adequate resource requests and limits to prevent pod evictions and OOMKilled events.
Apply Pod Disruption Budgets (PDB) to guarantee minimal service availability during maintenance. Enforce security policies robustly to safeguard against misconfigurations that cause downtime.
- Do not use the
latestimage tag in production - immutability prevents rollback chaos. - Define resource requests and limits for every container; it stabilizes scheduling.
- Set Pod Disruption Budgets and use namespaces for isolation at scale.
- Regularly validate RoleBindings and security policies - RBAC misconfigurations often manifest as mysterious API errors.
- Test pods under load before scaling policies engage. HPA and Cluster Autoscaler must align with real demands, not peak estimates.
Also Read: Are You Missing These Kubernetes Cost Optimization Best Practices & Tools?
Autoscaling and Resource Management
Effective autoscaling using Horizontal Pod Autoscaler (HPA) and Cluster Autoscaler optimizes resource allocation for fluctuating workloads. Continuous monitoring and tuning of resource consumption prevent bottlenecks and reduce cloud costs. Combining autoscaling with proactive alerts bolsters cluster resilience.
- Configure HPAs with balanced thresholds - too aggressive scaling causes oscillations, too relaxed ones delay recovery.
- For Cluster Autoscaler, integrate with node taints to prevent over-provisioning.
- Continuously monitor metrics like CPU throttling and memory pressure to tune requests efficiently.
Conclusion
Adopting proactive monitoring, disciplined troubleshooting, and best practices empowers teams to maintain robust, scalable Kubernetes environments. Improwised Technologies offers expert Kubernetes consulting and managed services to streamline troubleshooting, optimize cloud-native workflows, and enable your team to resolve issues like pros. Explore their solutions for tailored support and enhanced platform reliability.
Frequently Asked Question
Get quick answers to common queries. Explore our FAQs for helpful insights and solutions.

By Shyam Kapdi
Improwised Technologies Pvt. Ltd.
By Shyam Kapdi
Improwised Technologies Pvt. Ltd.
By Shyam Kapdi
Improwised Technologies Pvt. Ltd.
Optimize Your Cloud. Cut Costs. Accelerate Performance.
Struggling with slow deployments and rising cloud costs?
Our tailored platform engineering solutions enhance efficiency, boost speed, and reduce expenses.