October 31, 2025
Kubernetes Monitoring and Observability Stack Setup: Best Tools and Cost Monitoring

Annavar Satish
Author

Priyank Dhami
Contributor

Rakshit Menpara
Reviewer
Introduction
Kubernetes serves as the foundational framework for contemporary cloud-native infrastructure, enabling a diverse range of applications across various sectors. Kubernetes monitoring and observability are essential for maintaining the reliability and efficiency of these environments. Monitoring is essential for maintaining system health and performance, whereas observability delivers profound understanding via correlation of metrics, logs, and traces. These features are crucial for keeping things stable and controlling costs, helping organizations make the most of their cloud spending while still maintaining good performance.
Platform engineering teams at Improwised Technologies provide scalable, self-service observability stacks that empower developers, simplify complexity, and meet business goals. Through the help of this article, platform engineers, DevOps teams, and cloud architects will learn how to set up Kubernetes monitoring and observability stacks using cost management best practices to maximize ROI.
Understanding Monitoring vs. Observability in Kubernetes
Kubernetes monitoring and observability are two different things, even though they are commonly used interchangeably:
- Kubernetes monitoring is the process of collecting and examining logs and metrics to monitor the status of a system. It says, “Is the system working?”
- Observability is the ability to figure out what is going on inside a system based on what it emits. This is done using three telemetry pillars:
- Metrics: Numbers like CPU use, RAM, and request rates.
- Logs: Detailed records of events that give context to incidents.
- Traces: Tracking requests from start to finish to show how systems interact and how long they take.
Together, they make it possible to debug problems and improve performance before they happen, which is very important in dynamic Kubernetes environments.
Kubernetes Native Tools and Vendor Integrations
It’s also crucial to know about native Kubernetes observability choices and vendor-specific solutions, in addition to third-party tools:
- kubectl top shows how many resources nodes and pods are using right now.
- The Kubernetes Dashboard has a built-in user interface for basic health and metrics monitoring.
- AWS CloudWatch Container Insights, Google Cloud Operations Suite, and Azure Monitor: they all offer managed observability that is specific to Kubernetes clusters running on their platforms.
- Prometheus is built into Rancher Observability, which lets you monitor and get alerts.
Adding these tools to a full-stack monitoring approach is necessary for hybrid or multi-cloud deployments.
Platform Engineering and Observability Stack Fit
Platform engineering teams work on building self-service observability platforms that:
- Simplify the complex aspects of various monitoring tools for better understanding.
- Use the same method for collecting and notifying data across different teams and applications.
- Use Infrastructure as Code (IaC) to automate deployment and updates.
This strategy makes developers’ work faster, encourages multi-team and multi-application work together, and obeys the rules in regulated industries. An integrated observability interface keeps service standards the same while making operations easier.
Also Read: Kubernetes and Platform Engineering: A Match Made in Cloud Heaven
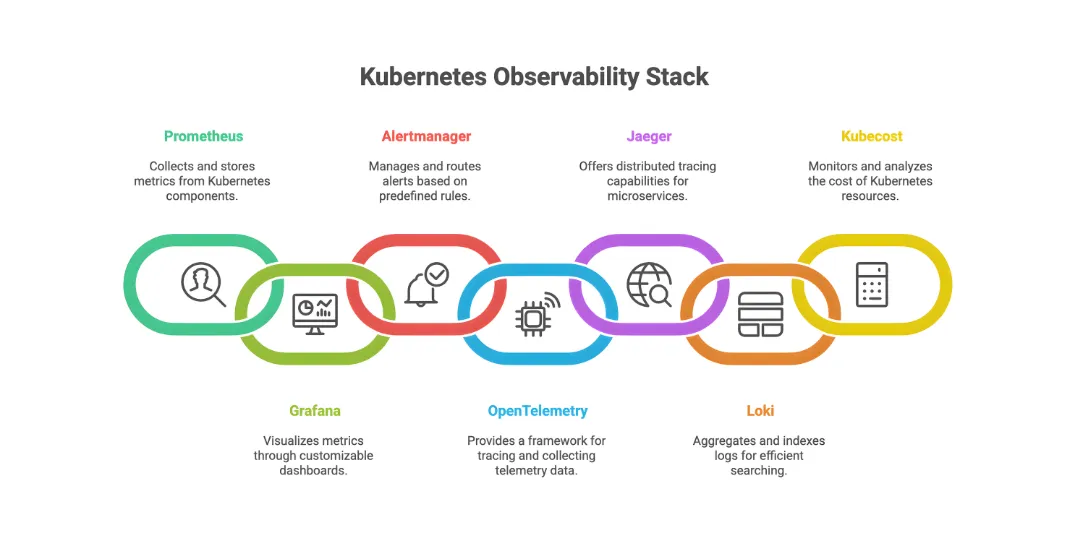
Key Components of a Kubernetes Observability Stack
A modern observability stack is modular and covers cluster-level, node-level, and application-level monitoring:
| Stack Layer | Examples | Purpose |
|---|---|---|
| Metrics | Prometheus, kube-state-metrics, Node Exporter | Collect core resource and app performance data |
| Dashboards | Grafana | Visualize metrics and create alert dashboards |
| Alerting | Alertmanager | Configure and deliver alerts based on metrics |
| Tracing | OpenTelemetry, Jaeger | Capture distributed trace data for requests |
| Logging | Loki, Fluentd, Elasticsearch | Centralize and analyze container logs |
| APM/SaaS | New Relic, Datadog, Dynatrace | Full-stack monitoring with integrated analytics |
Prometheus and Grafana Setup Example
Use Helm for seamless deployment:
bash

helm repo add prometheus-community https://prometheus-community.github.io/helm-charts
helm repo add grafana https://grafana.github.io/helm-charts
helm repo update

kubectl create namespace monitoring

helm install prometheus prometheus-community/kube-prometheus-stack \-n monitoring
helm install grafana grafana/grafana \-n monitoring

kubectl rollout status deployment/prometheus-kube-prometheus-prometheus \-n monitoring
kubectl rollout status deployment/grafana \-n monitoring

kubectl get secret \--namespace monitoring grafana \-o jsonpath="{.data.admin-password}" | base64 \--decode ; echo
kubectl port-forward svc/grafana 3000:80 \-n monitoring
Open Grafana at
, log in with the password above, and configure Prometheus as the data source.
Challenges and Solutions in Kubernetes Observability
Managing observability at scale within Kubernetes presents distinct challenges:
- Dynamic workloads and ephemeral resources lead to rapid pod scaling and restarts, resulting in data gaps.
Recommendation: Implement Prometheus service discovery alongside OpenTelemetry for automatic instrumentation. - Elevated Data Volume: Logs and metrics may exceed storage capacity and network bandwidth.
Proposed Approach: Utilize data sampling techniques, establish retention policies, and deploy eBPF-based lightweight telemetry solutions. - Isolated Telemetry Data: Fragmented logs, traces, and metrics hinder the efficiency of troubleshooting processes.
Recommendation: Implement integrated observability systems that analyze and correlate various telemetry sources.
It is essential to tackle these issues to develop robust monitoring frameworks that can adapt to evolving business requirements.
AI/ML-Powered Monitoring and Future Trends
Artificial Intelligence and Machine Learning are having a bigger and bigger effect on the future of Kubernetes observability:
- Anomaly Detection: AI-powered tools can find strange behavior in a system without having to define thresholds first.
- Automated Root Cause Analysis: Machine learning links measurements and traces to find the source of failures more quickly.
- Predictive Alerts: AI can tell when something serious is likely to happen before it does.
Dynatrace’s Davis AI and New Relic’s Applied Intelligence are two examples. Putting these new technologies together gets businesses ready for proactive, automated incident management.
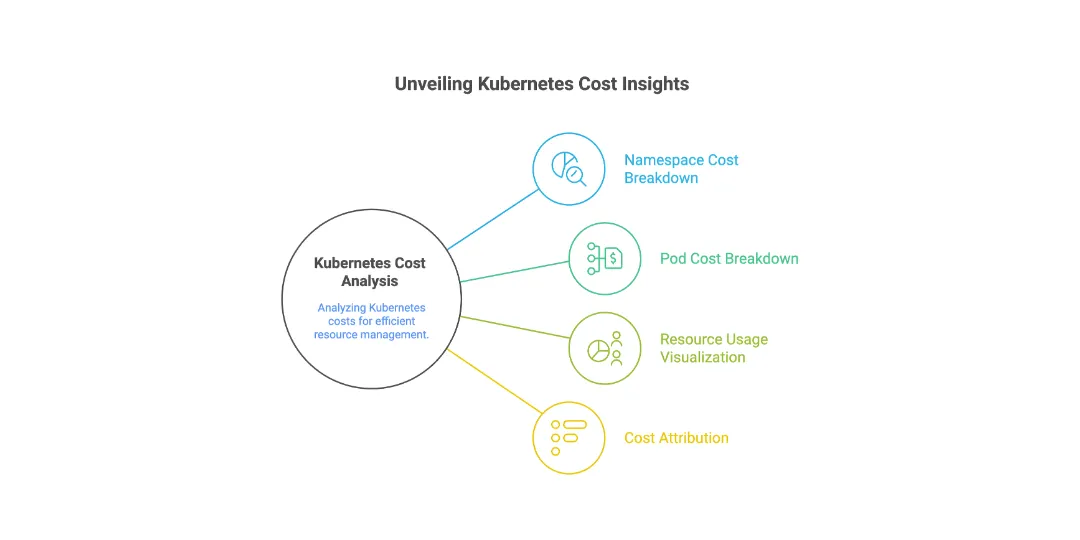
Cost Monitoring and Optimization in Kubernetes
To keep cloud fees from getting out of hand, it’s important to keep costs in check when deploying Kubernetes:
- Tools like Kubecost, CloudZero, OpenCost, and Finout can show you how much each namespace, pod, and service costs.
- FinOps combines financial control with DevOps to make budgeting, forecasting, and spending optimization possible.
- Set up alarms for unexpected cost increases, make sure resources are used as efficiently as possible, and make sure tagging procedures are followed for better visibility.
Kubecost Installation Quick Guide
bash

kubectl create namespace kubecost

helm repo add kubecost https://kubecost.github.io/cost-analyzer/
helm repo update

helm install kubecost kubecost/cost-analyzer \-n kubecost

kubectl port-forward \--namespace kubecost deployment/kubecost-cost-analyzer 9090
Access Kubecost dashboard at
to monitor expenses broken down by Kubernetes resources.
Tool Comparison Table
| Tool | Type | Metrics | Logs | Tracing | Alerting | Cost Monitoring | Pricing Model |
|---|---|---|---|---|---|---|---|
| Prometheus | Open Source | Yes | No | No | Yes | No | Free |
| Grafana | Open Source | Visualization | Logs (via Loki) | Visualize traces | Alerting | No | Free/Paid Enterprise |
| Jaeger | Open Source | No | No | Yes | No | No | Free |
| Loki | Open Source | No | Yes | No | No | No | Free |
| Kubecost | Open Source/Commercial | Yes | No | No | Yes | Yes | Free tier + Paid plans |
| New Relic | SaaS | Yes | Yes | Yes | Yes | Yes | Subscription-based |
| Datadog | SaaS | Yes | Yes | Yes | Yes | Yes | Subscription-based |
Security Monitoring and Compliance Observability
Security is paramount in production Kubernetes environments:
- Use observability stacks to monitor RBAC changes, audit logs, and network policies.
- Detect configuration drifts that might introduce vulnerabilities.
- Integrate with compliance frameworks by collecting logs necessary for audits.
- Alert on anomalous access or policy violations.
This ensures observability is aligned with security governance and regulatory requirements.
CI/CD Integration Examples
Automate observability stack deployment using CI/CD for consistent environments:
Example snippet for a GitHub Actions workflow deploying the Prometheus stack:
text

name: Deploy Monitoring Stack
on:
  push:
    branches:
      \- main
jobs:
  deploy:
    runs-on: ubuntu-latest
    steps:
      \- name: Checkout repo
        uses: actions/checkout@v3

      \- name: Set up Kubernetes kubectl
        uses: azure/setup-kubectl@v3
        with:
          version: 'latest'

      \- name: Deploy Prometheus with Helm
        run: |
          helm repo add prometheus-community https://prometheus-community.github.io/helm-charts
          helm repo update
          kubectl create namespace monitoring || true
          helm upgrade \--install prometheus prometheus-community/kube-prometheus-stack \-n monitoring –values values.yaml
Integrating monitoring setup in pipelines empowers DevOps automation and reduces manual errors.
Best Practices for Kubernetes Monitoring and Observability
- Set Service Level Objectives (SLOs) and keep an eye on the Golden Signals: latency, traffic, error rates, and saturation.
- Make dashboards and alerting policies that are the same for everyone and depend on their roles.
- Add multi-tenancy to accommodate multiple apps and teams.
- Keep incident response runbooks up to date and connect them to paging tools.
- Always monitor the security posture and compliance.
Also Read: Fargate vs. Kubernetes: An In-Depth Comparison for Container Orchestration
Conclusion
Kubernetes monitoring and observability are the building blocks of cloud platforms that are reliable, rapid, and cheap. Improwised Technologies helps businesses set up self-service observability stacks that give them useful information and help them reach their business goals by using an expert platform engineering methodology.
Are you ready to get the most out of your Kubernetes investments? Get in touch with Improwised’s team of platform engineering experts immediately for professional help with custom Kubernetes monitoring solutions, audits, and continuous platform engineering support.
Frequently Asked Question
Get quick answers to common queries. Explore our FAQs for helpful insights and solutions.
Written by
Annavar Satish
Satish is seasoned DevOps Engineer with strong expertise in CI/CD and cloud-native practices. Experienced with Git, Docker, Kubernetes, K3s, Helm, Rancher, Prometheus, Grafana, and alerting systems to ensure reliable software delivery. Passionate about innovation, I’ve also integrated tools like Frigate, DeepStack, DoubleTake, CompreFace, and IoT technologies to optimize and automate workflows.
February 12, 2026
DevSecOps Architecture Explained: Security as Code, Policy Automation, and GitOps
Chintan Viradiya
Author

January 22, 2026
FluxCD with Helm: Scaling Platform Governance via GitOps Reconciliation
Chintan Viradiya
Author
January 19, 2026
Site Reliability Engineering in Practice: Building Reliable Systems at Scale
Annavar Satish
Author
Optimize Your Cloud. Cut Costs. Accelerate Performance.
Struggling with slow deployments and rising cloud costs?
Our tailored platform engineering solutions enhance efficiency, boost speed, and reduce expenses.