January 19, 2026
Site Reliability Engineering in Practice: Building Reliable Systems at Scale

Annavar Satish
Author

Shyam Kapdi
Contributor

Rakshit Menpara
Reviewer
Operating systems at scale are a problem of probability, coordination, and constraints. As traffic grows, dependencies multiply, and release frequency increases, failure stops being an exception and becomes a predictable outcome. Hardware fails - network partition. Deployments introduce regressions. Human operators make incorrect decisions under pressure.
DevOps practices improve delivery flow, but they do not define how much unreliability is acceptable, when teams must stop shipping, or how reliability trade-offs are made. Continuous delivery without explicit reliability controls converts speed into risk.
Site Reliability Engineering (SRE) treats reliability as an engineering problem with measurable inputs, explicit targets, and enforced feedback loops. It replaces implicit expectations with contracts, and intuition-driven decisions with shared signals.
This article explains how SRE works in practice: how reliability is defined, measured, enforced, and improved in real production systems.
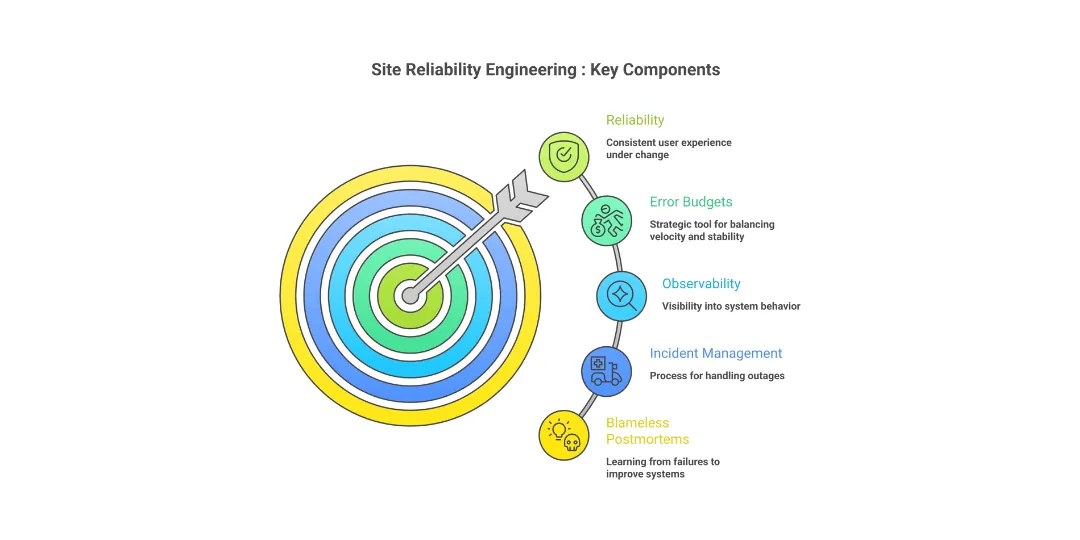
2. Define Reliability From the User’s Perspective
What is SRE?
SRE is the discipline of applying software engineering to operations problems to deliver a consistent user experience under continuous change.
Reliability is not infrastructure uptime. It is the probability that a user request completes correctly within an acceptable time window.
- Service Level Agreement (SLA): A contract with users that includes consequences, such as financial penalties, if SLOs are not met.
- Service Level Objective (SLO): A target value for an SLI over a period. An SLO is an internal goal, not a promise. Setting an SLO at 99.99% availability means tolerating 0.01% unreliability.
- Service Level Indicator (SLI): A direct measure of a service’s behavior. Examples are request latency, error rate, and availability. The measurement must correlate with user experience.
Confusing these layers creates failure modes:
- Treating an SLO as an SLA leads to over-engineering and delivery paralysis.
- Treating an SLA as an internal target leads to repeated contractual breaches.
- Measuring infrastructure health instead of user-facing SLIs leads to blind spots.
Choosing Realistic SLOs
SLOs represent a balance between user tolerance and system cost. Pursuing 100% availability is mathematically impossible in distributed systems. Each additional nine hours of availability increases cost, complexity, and operational load while delivering diminishing user value.
3. Error Budgets: Turning Reliability Into a Strategic Decision Tool
Reliability is not an infinite resource; it is a measurable constraint. In Site Reliability Engineering (SRE), the Error Budget serves as the formal bridge between product velocity and system stability.
The Mathematics of the 99.99% Reality
An Error Budget is the quantitative inverse of a Service Level Objective (SLO). If a service defines an SLO of 99.99% availability, the remaining 0.01% is the Error Budget.
- 99.9% (Three Nines): - 43.2 minutes of downtime per month.
- 99.99% (Four Nines): - 4.3 minutes of downtime per month.
- 100%: A technical impossibility that halts innovation.
Pursuing 100% reliability is counterproductive. The cost of achieving the final 0.01% often outweighs the marginal utility to the user. The Error Budget acknowledges that some failure is acceptable as a trade-off for feature delivery.
Data-Driven Triggers for Release Velocity
Error budgets remove subjectivity from engineering priorities. When a budget is healthy, teams take calculated risks and deploy frequently. When the budget “burns” through unexpected incidents or high latency, the data triggers specific operational shifts:
- Feature Freezes: If the error budget is exhausted, the team halts new feature releases - engineering capacity shifts entirely to reliability.
- Backlog Prioritization: Reliability debt, such as patching, scaling, or refactoring, automatically moves to the top of the sprint ahead of new functional requirements.
- Production Readiness: Services must meet strict telemetry and performance standards before they are permitted to consume any portion of the remaining budget.
Stress-Testing the Human System
Reliability is a function of both software and human response. Technical systems are validated through code; human systems are validated through Mock Drills and Game Days.
- Game Day Execution: Engineers intentionally inject faults into production or staging environments to observe system behavior and team response.
- Incident Roles: Drills clarify specific responsibilities, such as the Incident Commander (IC), Communications Lead, and Operations Lead, ensuring no overlap or gaps during high-pressure events.
- The Blameless Retrospective: Post-incident analysis focuses on mechanical and systemic gaps rather than individual errors. The goal is to identify why the system allowed a human to make a mistake, then implement a technical guardrail to prevent recurrence.
- Verification: Reliability is only confirmed once the fix is deployed and the system’s “burn rate” returns to nominal levels.
4. Design for Failure, Not Perfection
In distributed systems, uptime is not a product of flawless components; it is the result of architectural decisions that assume failure. When operating at scale, hardware malfunctions, network partitions, and latent software bugs are statistical certainties.
To maintain system integrity, engineers must shift from the pursuit of perfection to the mastery of resilience.
Also Read: Zero Downtime Architecture: How Platform Engineering Future-Proofs Systems
Fault Isolation: The Bulkhead Pattern
Unbounded dependencies create paths for cascading failures. Without isolation, a latency spike in a non-critical microservice can exhaust the connection pools of the entire ecosystem.
- Implementation: Use Bulkheads to partition resources. By isolating thread pools, memory segments, or deployment clusters, you ensure that a failure in one partition does not saturate the resources required by others.
- The Goal: Confine the “blast radius” to the local component.
Graceful Degradation and Critical Paths
Systems should be designed with a hierarchy of functionality. When a dependency fails, the system must shed non-essential load to preserve the core user experience.
- Static Contingency: If a recommendation engine fails, the application should serve cached or static defaults rather than returning a 500 error.
- Circuit Breakers: Implement logic to trip and redirect traffic when error thresholds are met, preventing the system from repeatedly querying a failing resource.
Controlled Chaos: Validation via Injection
Observability is the prerequisite for Chaos Engineering. Injecting faults - such as network latency or pod terminations - without robust monitoring is negligence, not testing.
- Prerequisites: High-cardinality logging and automated rollback triggers.
- Execution: Inject failures in production environments to verify that recovery mechanisms (like auto-scaling groups and health checks) trigger as designed.
The Three Pillars of Failure Logic
When a component fails, it must adhere to three technical mandates:
- Fail Safely: Maintain state integrity. Use atomic transactions and idempotent operations to ensure data does not corrupt during a crash.
- Fail Loudly: Silence masks debt. Failures must trigger immediate telemetry alerts. If a system fails “quietly,” the mean time to detection (MTTD) increases, compounding the risk.
- Automatic Recovery: Utilize Reconciliation Loops. The system must constantly compare the current state against the desired state and execute corrective actions without manual intervention.
5. Observability as a Reliability Multiplier
Observability determines whether reliability targets are enforceable or theoretical. Monitoring answers whether a system is failing. Observability explains which users are affected, where degradation occurs, and how failure propagates across services.
- Symptom vs. Root Cause
Reactive monitoring triggers alerts based on component thresholds, such as CPU usage, memory utilization, or pod restarts. These signals indicate stress, not user impact. Observability starts from symptoms visible to users and works backward through the system.
Platforms such as Datadog and New Relic model services as request paths, rather than isolated resources. Latency, Traffic, error rate, and saturation are evaluated at service boundaries, allowing teams to detect degradation before full outages occur.
- High-Cardinality Analysis
User-facing failures rarely affect all traffic uniformly. They correlate with attributes such as region, tenant, API version, or feature flag state. Metrics systems alone collapse this detail.
Log pipelines built on the Elastic Stack retain high-cardinality dimensions. Engineers can isolate impacted cohorts by filtering on request identifiers, customer metadata, or execution paths, enabling targeted remediation instead of global rollback.
- Signal Correlation Across Telemetry
Mean Time to Recovery improves when metrics, logs, and traces converge on the same failure point.
Metrics collected by Prometheus identify when reliability thresholds are breached. Distributed traces from Jaeger reveal how latency or errors accumulate across service hops. Correlating these signals exposes dependency-induced failure and contention patterns that single-signal monitoring cannot surface.
- SLO-Driven Alerting
Alerting tied to infrastructure metrics produces noise without decision context. Alerting tied to Service Level Objectives produces action.
Dashboards in Grafana track SLO burn rates instead of raw thresholds. Alerts fire when error budget consumption exceeds defined windows, signaling risk to user experience rather than internal resource fluctuation.
- Cognitive Load Reduction During Incidents
Incidents fail when engineers spend time interpreting dashboards instead of executing recovery. Unified views that combine SLO status, recent deploys, traffic shifts, and dependency health reduce decision latency.
6. Build a Strong Incident Management Practice
1. Establishing Ownership through SLOs and Rotations
Ownership is defined by data and availability, not vague responsibility.
- Service-Level Objectives (SLOs): You must define technical thresholds for success (e.g., “99.9% of requests must complete under 200ms”). When an SLO is breached, the incident management process triggers automatically.
- On-Call Rotations: Use a primary/secondary rotation schedule. This ensures 24/7 coverage while preventing burnout. Engineers on call must have “write” access to production and a deep understanding of the service’s dependency graph.
2. Time-Bound Escalation Paths
Escalation is a tool to inject resources, not a signal of failure.
- Functional Escalation: If the primary responder cannot identify the root cause within a set window (e.g., 15 minutes), the incident shifts to a subject matter expert (SME) or a specific component team.
- Hierarchical Escalation: If an incident impacts a critical percentage of the user base or exceeds a recovery time objective (RTO), management is notified to handle external communication and resource allocation.
3. Implementing an Incident Command System
High-intensity incidents require a strict communication protocol to reduce cognitive load and noise.
- Incident Commander (IC): The IC holds the highest authority during the event. They do not write code or log into servers. Their sole focus is delegating tasks, tracking timelines, and making final decisions.
- Ops Lead: The Ops Lead manages the technical execution. They direct the “hands-on-keyboard” work and report progress back to the IC.
- Communication Lead: This role manages status pages and internal stakeholder updates, shielding the technical team from distractions.
Also Read: Day-2 Operations: Building Reliable, Scalable, and Operable Production Systems
4. Engineering a Blameless Culture
A blameless culture treats outages as data points rather than performance issues.
- Systemic Analysis: Post-mortems must focus on why the system allowed a human to make a mistake. If a single command can take down a cluster, the flaw is in the lack of guardrails, not the person who typed the command.
- Actionable Outcomes: Every incident must result in a set of “Corrective Actions” (backlog items) that address the technical debt or architectural weakness identified during the outage.
7. Blameless Postmortems That Actually Improve Systems
A postmortem is not a performance review. It is a technical document designed to identify how a system failed and how to modify that system to prevent recurrence. When an incident occurs, the primary goal is to extract maximum data from the failure.
The Failure of Blame
Blame stops investigations. If an engineer fears disciplinary action, they will withhold details regarding their actions or observations. This creates “dark matter” in your incident data.
Shifting from “Who did this?” to “How did the system allow this to happen?” is a functional requirement for learning. Blame focuses on individual compliance; blamelessness focuses on systemic robustness. Without transparency, you cannot identify the latent conditions that lead to outages, ensuring repeat failures.
Beyond the “Root Cause” Fallacy
In complex software systems, there is rarely a single root cause. Attributing a failure to one point (e.g., “human error”) is a reductive fallacy that ignores the context of the environment.
We must analyze the intersection of Contributing Factors:
- Triggering Events: The immediate action (e.g., a specific PR merge).
- Latent Conditions: Existing bugs or architectural weaknesses that were dormant.
- Tooling Gaps: Lack of observability or guardrails that failed to catch the issue.
Structural Anatomy of a Postmortem
1. Timeline
This section must contain objective, timestamped facts. It includes when the first alert fired, when engineers joined the bridge, what commands were executed, and when the system returned to its baseline state. It excludes speculation.
2. Systemic Analysis
This is the technical core. You examine why the architecture permitted the failure.
- Did a load balancer fail to circuit-break?
- Did a retry policy cause a thundering herd?
- Was the blast radius larger than anticipated due to tight coupling?
3. Remediation
Lessons must be converted into trackable engineering tasks. Each task requires an owner and a deadline. If a postmortem does not result in a pull request or a configuration change, the incident was not resolved - it was merely paused.
Strategic Data and the Product Roadmap
Postmortems provide the empirical data needed to justify technical debt reduction. By categorizing incident trends (e.g., “30% of downtime caused by database connection exhaustion”), engineering leaders can influence the product roadmap.
This data transforms “cleaning up code” from a subjective preference into a strategic necessity for system availability. Use these trends to pivot from reactive firefighting to proactive architectural hardening.
8. Conclusion: SRE as a Long-Term Engineering Investment
Site Reliability Engineering is not a checklist, a toolset, or a rebranding of operations teams. It is an operating model that defines how reliability decisions are made, enforced, and evolved as systems scale. Without explicit reliability mechanisms, organizations rely on heroics, tribal knowledge, and post-incident reactions, which do not scale with system complexity or release velocity.
Reliability does not emerge from isolated fixes after outages. It emerges from repeatable engineering practices: defining user-centric SLOs, enforcing error budgets, designing for failure, automating recovery, and feeding incident data back into system design. These practices convert reliability from an implicit expectation into an explicit, measurable property of the system.
Teams that adopt SRE practices create predictable behavior under load and change. Product teams gain clarity on when speed is acceptable and when stability must take priority. Engineering teams gain authority to block unsafe changes based on data. Leadership gains visibility into reliability risk and its impact on revenue and trust.
Frequently Asked Question
Get quick answers to common queries. Explore our FAQs for helpful insights and solutions.
Written by
Annavar Satish
Satish is seasoned DevOps Engineer with strong expertise in CI/CD and cloud-native practices. Experienced with Git, Docker, Kubernetes, K3s, Helm, Rancher, Prometheus, Grafana, and alerting systems to ensure reliable software delivery. Passionate about innovation, I’ve also integrated tools like Frigate, DeepStack, DoubleTake, CompreFace, and IoT technologies to optimize and automate workflows.
February 12, 2026
DevSecOps Architecture Explained: Security as Code, Policy Automation, and GitOps
Chintan Viradiya
Author

January 22, 2026
FluxCD with Helm: Scaling Platform Governance via GitOps Reconciliation
Chintan Viradiya
Author
January 2, 2026
Day-2 Operations: Building Reliable, Scalable, and Operable Production Systems
Shyam Kapdi
Author
Optimize Your Cloud. Cut Costs. Accelerate Performance.
Struggling with slow deployments and rising cloud costs?
Our tailored platform engineering solutions enhance efficiency, boost speed, and reduce expenses.