
September 16, 2026
What Actually Slows Kubernetes Down (And What to Fix Before Adding Nodes)

Hussain Gandhi
Author

Shyam Kapdi
Contributor

Shailesh Davara
Reviewer
A cluster starts lagging. Pods take longer to respond. Someone on the team says the obvious thing: “We need more nodes.” Within a week, there’s a ticket, a budget line, and a bigger bill. Nobody checked whether the cluster actually needed more capacity or whether it just needed to be configured correctly.
This post is not about Kubernetes internals. It’s about the order in which you should check things before you spend money on hardware you may not need.
The instinct to add nodes, and why it’s usually the wrong first move
Adding nodes is the easiest decision to make and the hardest one to reverse. It doesn’t require anyone to admit a config was wrong. It doesn’t require a difficult conversation about ownership. It just requires a purchase order. But more hardware doesn’t fix a scheduling problem, a throttling problem, or a storage bottleneck; it just gives those problems more room to hide.
The bill goes up every month after that, and the underlying issue is still there, waiting to resurface the next time traffic increases. This is the exact trap we outline in our breakdown of Cloud Cost Optimization and why architecture matters more than pricing.
Check requests and limits before anything else
This is the single most common cause of “the cluster feels slow.” Not because it’s the most likely technical failure, but because it’s the most commonly skipped check.
Here’s what happens when requests and limits are misconfigured:
- Pods get throttled, and it looks like slowness. A container hits its CPU limit and gets capped, even though the node itself has capacity to spare. From the outside, this looks exactly like “we don’t have enough compute.” It isn’t.
- The scheduler makes bad placement decisions. If requests are set too low, too many pods get packed onto one node, and they compete for real resources the scheduler didn’t account for.
- Autoscalers get fooled. Cluster autoscalers and pod autoscalers make decisions based on requests, not actual usage. Wrong requests mean wrong scaling decisions, in both directions.
The fast check: Pull CPU throttling metrics for your workloads (most monitoring stacks expose this directly). If you see sustained throttling on pods that aren’t near their memory limits, you’ve found your answer, and it has nothing to do with node count.
Noisy neighbor problems on shared nodes
This one is easy to misdiagnose because it presents as “we need more capacity” when it’s actually “one workload is taking more than its share, and nothing is stopping it.”
- A batch job or a reporting workload spikes CPU or I/O and starves everything else sharing that node.
- Teams see the slowdown on unrelated services and assume the cluster overall is under-resourced.
- The real fix is isolation, dedicated node pools, resource quotas, or priority classes, not a bigger cluster. See how we implemented this exact kind of isolation to boost performance by 60% in our Lead Generation Platform Case Study.
If your slowdowns are inconsistent and hit different services at different times, this is worth checking before anything else.
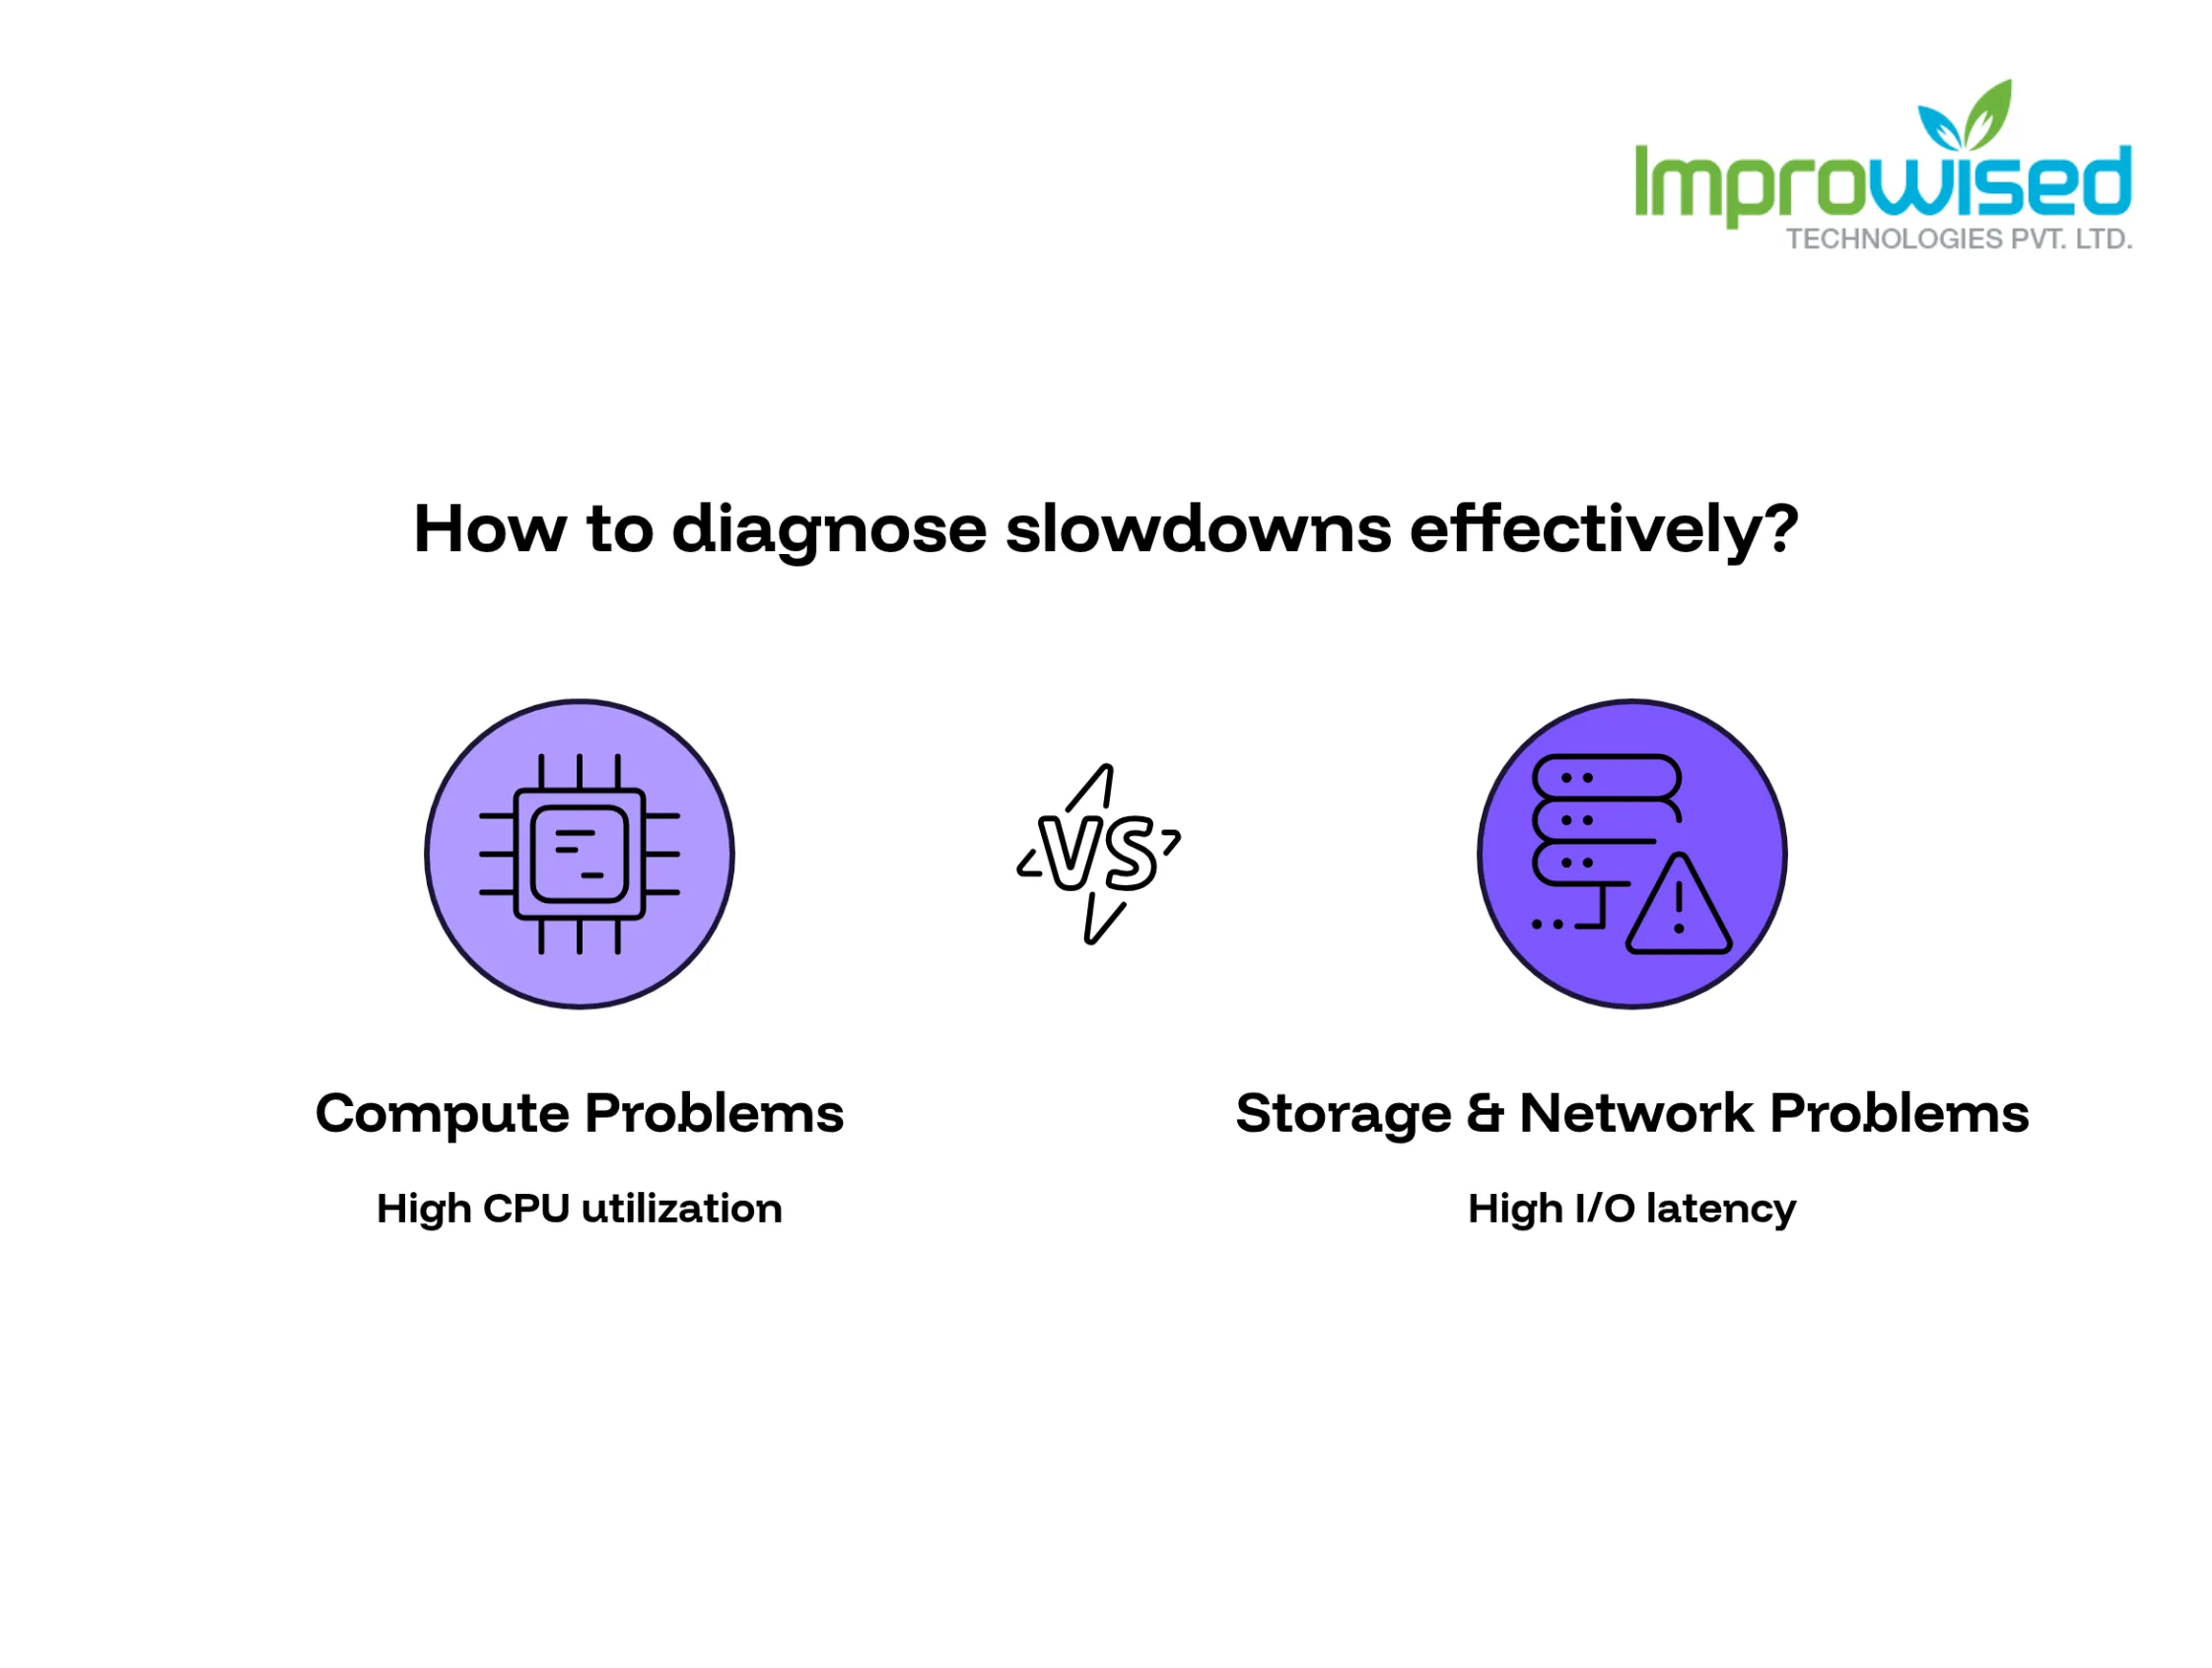
Storage and network bottlenecks that look like compute problems
Not every slowdown is a compute problem, even when it looks like one.
- Slow persistent volume performance. A workload waiting on disk I/O looks identical to a workload waiting on CPU from the outside. Check volume latency before you check node utilization.
- DNS resolution delays. CoreDNS under load, or misconfigured DNS caching, adds latency to every service call. This shows up as generalized “everything feels slow,” which is exactly what makes people reach for more nodes.
- Network policy overhead. Heavy network policy rules, or a service mesh with unoptimized sidecar configuration, add real latency per request. It’s rarely obvious unless you’re specifically looking for it.
When autoscaling configuration itself is the problem
A lot of teams have autoscaling turned on and assume that means it’s working. It often isn’t.
- Reactive-only scaling. The autoscaler only responds after the load has already increased, with no quick-low threshold, so users feel the lag before the system catches up.
- No scale-down policy. Capacity gets added under load and never comes back down, so the cluster runs oversized and overpriced long after the spike is gone.
- Thresholds set too conservatively. Scaling triggers are set so high that the system takes too long to react, which cripples the problem xzhdvv before solving it.
A working autoscaling setup scales ahead of demand with a small buffer, and scales back down on a schedule your team actually reviews, not just a default nobody has touched since setup.
A basic diagnostic order to run before scaling out
Run these in order. Don’t skip to step 6.
- Check CPU throttling metrics on affected workloads, not just raw CPU usage.
- Review requests and limits against actual usage over the last 7–14 days.
- Check for noisy neighbors; look at resource usage per node, not just per pod.
- Check persistent volume latency for any workload doing significant read/write.
- Check DNS resolution times and network policy overhead, especially if the slowdown is cluster-wide rather than workload-specific.
- Review autoscaler configuration and logs to see if scaling events are happening when they should, not after.
If you’ve run all six and the cluster is still consistently maxed out with no configuration issue in sight, you have your answer, and it’s a real one. If your team lacks the observability to easily run these six checks, take our free Platform Engineering Maturity Assessment to find your operational blind spots.
When adding nodes actually is the right call
None of this means scaling out is wrong. Sometimes it’s exactly right.
- Your workload has genuinely outgrown the capacity it was allocated, and usage data confirms it.
- You have a real seasonal spike, retail traffic in November, tax season, an enrollment period, and you need headroom for a defined window.
- You’ve run the checks above, fixed what needed fixing, and the cluster is still tight.
Scaling out is a legitimate decision when it’s based on data. The problem is never the node count. The problem is treating it as the first move instead of the last one.
Infrastructure & Architecture Review: Send us a snapshot of your cluster metrics. We’ll tell you, honestly, whether this is a config fix or a real capacity problem, before you commit to a bigger bill.
We’ll tell you, honestly, whether this is a config fix or a real capacity problem, before you commit to a bigger bill. Contact our team today to get started.
Frequently Asked Question
Get quick answers to common queries. Explore our FAQs for helpful insights and solutions.
Because average CPU usage hides throttling. A pod can be capped by its CPU limit while the node itself has plenty of headroom left. Check throttling metrics specifically, not just overall utilization graphs.
Not as a first move. Check requests and limits, noisy neighbor issues, storage latency, DNS, and autoscaler behavior first. Add nodes only after you've confirmed the slowdown is a real capacity issue, not a configuration one.
CPU limits set too low relative to actual workload demand. The container hits its limit and gets throttled by the kernel's CFS scheduler, even if other nodes in the cluster have unused capacity.
It's when one workload on a shared node consumes a disproportionate share of CPU, memory, or I/O, starving other pods on the same node. It often looks like a cluster-wide capacity issue when it's actually a scheduling and isolation issue.
Yes. CoreDNS under load or misconfigured DNS caching adds latency to every service-to-service call. Because it affects nearly everything, it often gets mistaken for a broader performance or capacity problem.
Written by
Hussain Gandhi
Hussain Gandhi is a DevOps Engineer at Improwised Technologies Pvt Ltd. He focuses on building scalable systems through automation and scripting. He has hands-on experience with cloud infrastructure, CI/CD pipelines, and infrastructure as code. Hussain combines strong technical skills with a collaborative work style. In his free time, he enjoys learning new things.


September 18, 2026
What Platform Engineering Services Actually Include
Chintan Viradiya
Author



September 10, 2026
What Off-Premise Migration Actually Involves (And What It Costs)
Chandan Teekinavar
Author



September 7, 2026
What Uptime Assurance Actually Covers And What It Doesn't
Chintan Viradiya
Author
Optimize Your Cloud. Cut Costs. Accelerate Performance.
Struggling with slow deployments and rising cloud costs?
Our platform engineering solutions are built on open-source tools and use AI natively across the workflow.